
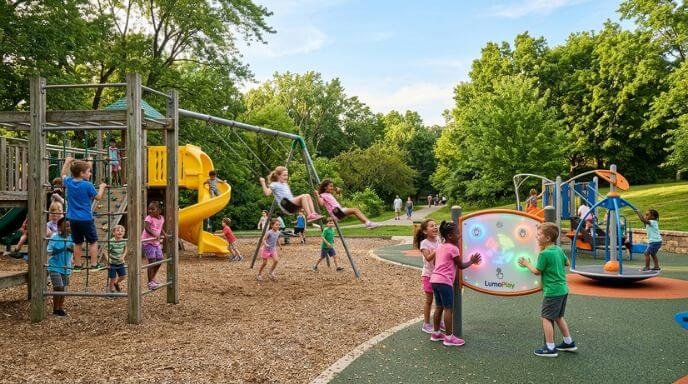
Electricity is now a line item in every playground budget. The EIA puts the U.S. commercial average at 14.19 cents per kWh as of June 2026, which turns each powered asset into a recurring operating cost rather than a one-time purchase. That single number is the reason non-powered vs electric playground equipment ROI rarely resolves the way buyers expect.
The trade-off runs in both directions. Unpowered equipment works without electricity, driven entirely by the user’s own energy, so it carries almost no running cost. Electric play equipment draws its power from an external source to add interactivity, and that capability buys throughput, longer dwell time and stronger pricing power.
This comparison covers five criteria across a 5 to 10 year total cost of ownership: upfront capital, operating and maintenance cost, payback period, revenue uplift, and fit by venue type.
Non-Powered vs Electric Playground Equipment ROI: The Summary Comparison
“Electric” playground equipment means play features that use an external power source to add interactivity, not a ride. A third category sits between the two: kid-powered energy products run entirely on the charge kids produce by spinning, pushing and pressing, so they are electronic without drawing from the grid.
| Criterion | Non-Powered | Electric / Interactive |
|---|---|---|
| Best For | High-traffic public parks, schools, campgrounds | Destination venues with admission pricing |
| Upfront Capital Cost | $15,000–$75,000+ equipment only | fall under special equipment regulations and require inspections, often driving the price tag well over a million. |
| Energy Cost | None | Ongoing, varies by feature count |
| Maintenance & Inspection | 1–3% of installed cost per year (AAA State of Play, 2025-05-14) | Higher: electronics add diagnostic and repair lines |
| Payback Period | Faster at most venues | Longer, depends on admission revenue |
| Revenue Uplift Potential | Modest | Higher at paid-entry venues |
| Service Life | 15–20 years, well maintained | Shorter refresh cycle on electronic components |
| Staffing Requirement | Standard grounds crew | Trained staff for powered features |
| Climate Dependence | Low | Higher: heat, moisture and freeze-thaw stress electronics |
| Our Verdict | Wins on total cost of ownership | Wins only where admission revenue is real |
Which Option Costs Less Upfront?
Non-powered equipment wins on upfront cost, and it wins by a wider margin the more complex the design gets. A commercial installation typically breaks into four cost clusters: equipment, installation labour, site preparation, and safety surfacing. Installation labour runs $5,000 to $20,000 depending on how long the crew is on site, with basic builds finishing in two to three days and premium or custom builds running one to two weeks. Site preparation adds $3,000 to $15,000, and surfacing runs $5 to $22 per square foot by material, from engineered wood fibre at the cheap end to poured-in-place rubber at the top. As a sanity check on the whole budget, a common planning benchmark sits at about $1,000 per child served.
Electric equipment adds cost lines that never appear in a non-powered quote: motors, control panels, wiring runs, electrical rough-in, and a licensed electrical sign-off. Those items sit on top of the same equipment, labour, prep, and surfacing clusters, which is why the electric premium scales with how far the play zone sits from an existing supply.
On a site that already has power, drainage, and hardstanding in place, that premium narrows sharply. The equipment difference stays, but the electrical and civil work largely disappears. Where the site is constrained, a custom-fabrication option such as playIdea can absorb awkward geometry into the design instead of into extra civil work, though custom fabrication typically costs 25% to 50% more than standard modular ranges, so it only pays off when it removes a larger site cost elsewhere.
Which Costs Less to Run and Maintain?
Non-powered equipment wins the operating-cost comparison, and it wins on structure rather than degree. Non-powered outdoor equipment draws zero electricity by definition, because it operates without a motor, control panel or power supply. Electric playground equipment operating costs inherit a permanent energy line the moment the equipment is energised, and that line has a published price: the EIA puts the U.S. commercial average at 14.19 cents per kWh for the June 2026 data month (U.S. Energy Information Administration, Electric Power Monthly Table 5.3).
Maintenance follows the same pattern, though the figures carry different confidence levels. Routine maintenance typically runs 1 to 3 percent of installed cost per year (AAA State of Play), roughly $400 to $1,200 annually on a $40,000 unit. A CPSI inspection runs $300 to $1,000 a year, and prudent operators hold back 10 to 15 percent of the annual budget for unplanned repairs (AAA State of Play). Those are municipal asset-management figures rather than vendor claims, which makes them the more defensible basis for planning.
Inspection obligations apply to both options. The regime is two-tier: high-frequency checks daily or weekly, with in-depth inspections quarterly or semi-annually. A CPSI-performed audit at handover becomes the baseline for the ongoing programme.
Vendor figures on the powered-versus-non-powered maintenance split vary widely, and the same sources sometimes contradict themselves, so treat any headline percentage as unstable and never build a budget on it alone.
The nuance matters. Non-powered is not free to run, it is cheap to run, and its inspection clock is the same regulatory clock every public play asset answers to.
Which Pays Back Faster?
Non-powered equipment pays back faster on pure cost recovery. Electric pays back faster only when incremental revenue outruns incremental operating cost, and that is a site condition, not a category property. The playground equipment payback period therefore has to be modelled per site, not read off a product category.
Build the model with five visible inputs: capital, annual energy, annual maintenance and inspection, annual revenue attributable to the asset, and the resulting simple payback in years. Every figure below is a planning assumption, not a benchmarked result.
| Input | Non-powered | Electric |
|---|---|---|
| Installed capital | $35,000–$65,000 for a campground or HOA project with surfacing | Upper-bound estimate only; no dated 2026 source confirms installed cost for powered outdoor equipment |
| Annual energy | Near zero | $20,000–$80,000 per motorized unit, plus a dedicated transformer where required |
| Annual maintenance | 1–3% of installed cost (AAA State of Play) | Same percentage band, applied to a higher base |
| Service life | 15–20 years for a well-maintained steel-and-plastic structure | Shorter intervals expected on motors and controls; not quantified here |
Key Takeaway: The payback verdict depends on five variables, attendance, pricing power, operating hours, climate, and venue type, and it changes sign across them.
A powered asset on a high-traffic paid-entry site can out-pay a non-powered one despite costing more. A non-powered asset on a free public site has no revenue side at all, only cost avoidance.
Which Earns More Revenue?
Electric and interactive play earns more revenue per visitor, and the mechanism is dwell time rather than ticket price. Active entertainment venues tend to hold visitors for two to three hours, against thirty to sixty minutes elsewhere. Reported spend per visitor also runs higher in entertainment-anchored centres, but that figure has no named study behind it, so treat it as directional only and never build a payback model on it.
Demand for the amenity is easier to defend. Industry surveys on family travel point to a large share of parents seeking out children’s amenities such as pools, game rooms and kids clubs when choosing accommodation. Those figures are secondary citations rather than directly reviewed studies, so weigh them accordingly.
The honest limit matters more than the upside. No third-party study directly ties a hotel kids club or play area to a fixed ADR, occupancy or RevPAR uplift. The only defensible method is a before-and-after measurement with matched dates, a control period and at least 60 days of operating data.
That refresh gap is the quiet ROI killer on the electric side. Interactive assets get refreshed at the system level sooner than their structure needs replacing, because their differentiator is experience novelty, not structural life. Component lifespans make the contrast plain: the frame usually outlasts everything bolted to it, with metal structures rated at 30+ years against 10 to 20 years for wooden components. Safety surfacing sits on the shortest clock of all, needing money years before the structure does.
Who Should Choose Which?
If the site is free-entry, lightly staffed or capital-constrained, choose non-powered. If it is paid-entry, high-traffic and staffed, the electric case strengthens.
Municipal parks and school districts: Non-powered. Cost avoidance is the whole return here, and routine maintenance typically runs 1 to 3 percent of installed cost per year, so that band is the number to budget rather than a revenue line.
Campgrounds, HOAs and community sites: Non-powered. A complete installed project for a campground or HOA lands at $35,000 to $65,000 with surfacing, which is the realistic envelope for this buyer.
Hotels, resorts and FEC operators with pricing power: Electric, conditionally. Dwell time is the revenue lever, and active entertainment venues hold visitors for two to three hours, against thirty to sixty minutes elsewhere, but measure your own before-and-after traffic rather than assuming uplift.
Mixed-use destinations: Both. Powered anchor features plus non-powered spillover capacity, which is where integration planning actually bites.
If neither profile fits, the binding constraint is usually site power, staffing or climate rather than the equipment choice itself. Talk to an expert or request a project consultation to map those constraints against your site plan.
Frequently Asked Questions
Is non-powered equipment always the higher-ROI choice?
No. Non-powered equipment usually wins on cost recovery because it carries no motors, controls, or power infrastructure to buy and service. Electric equipment can win where the site has pricing power: paid entry, extended hours, or a location that draws repeat visits. If your revenue per visitor is flat, non-powered is the safer bet.
Can I add powered features to an existing non-powered playground?
Yes, but the retrofit is where budgets overrun. You need an electrical rough-in to the play zone, a control enclosure, and a safe route for conduit that does not cross fall zones. Running power to an established site costs more than wiring a new build, because trenching, surface restoration, and inspection add-ons stack up after the fact.
How long before a playground pays for itself?
There is no single number. The payback period falls out of five variables: installed cost, attendance, price per visit, operating hours, and annual maintenance. Change any one and the answer moves. Build the model with your own inputs rather than borrowing a figure from another site.
Which option has lower total cost of ownership over 10 years?
Non-powered wins on cost, electric wins on revenue. Which matters depends on the side of the ledger you are optimising. If your constraint is capital recovery, non-powered is cheaper to own. If your constraint is revenue per square metre, electric can justify its higher running cost.
Is electric playground equipment worth it in 2026?
It depends on your electricity basis and your refresh cycle. The EIA puts the U.S. commercial average at 14.19 cents per kWh (U.S. Energy Information Administration, June 2026), so power itself is rarely the deciding cost. The bigger factor is that interactive assets get refreshed at the system level sooner than their structure needs replacing, which shortens the window you have to earn back the premium.
Conclusion
Non-powered equipment wins the playground equipment return on investment comparison on cost recovery. It carries the lower upfront spend, draws no energy, and routine maintenance typically runs 1 to 3 percent of installed cost per year, so the payback period arrives sooner. Electric equipment wins only where dwell time converts into revenue the site can actually charge for: active entertainment venues hold visitors for two to three hours, against thirty to sixty minutes elsewhere, and that extra time is what funds the higher total cost of ownership.
Which way the verdict tips depends on five variables the article has already worked through: attendance, pricing power, operating hours, climate, and venue type. Choose non-powered if you cannot reliably charge for time on the equipment. Choose electric if you can, and if your attendance and operating hours justify the energy, inspection, and maintenance load.